Counting What Counts: Green Tech and Credible Carbon Reduction
Driven by regulatory and procurement demands, destinations face mounting pressure to prove climate progress with credible data. Today, metrics that can't be compared with confidence carry little weight.
DTTT Knowledge Team
02 Jul 2026
In this piece
Destinations are increasingly asked to prove their climate progress with numbers that hold up. The pressure to deliver credible measurement has grown alongside regulatory disclosure and procurement requirements. A number that cannot be compared with confidence now carries less weight than it used to.
That has become more pressing as tourism’s own footprint has grown. The sector reached 8.8% of global greenhouse gas emissions in 2019, rising faster than the wider economy as demand climbed about 3.8% a year against efficiency gains of only around 0.3%.
Source: Claude.ai generated
The largest share of that footprint comes from transport, with aviation the single biggest source. Much of the rest sits in the energy and supply chains behind accommodation, food and goods.
Mitigation runs wider than carbon alone, taking in energy systems, land use and the non-CO2 warming from aviation that standard accounting leaves out. The part in focus here is narrower and more immediate: the measurement and transparency layer that decides whether a reduction is real or simply well phrased, together with the green tech now building it.
Establishing a Shared Baseline
You cannot reduce what you cannot compare. For years, the industry had no shared way to do so. Emissions figures came from different methods, covered different stretches of a journey and rarely lined up against each other. That changed on 1 June 2026, when CountEmissionsEU took effect.
The regulation sets one method, aligned with the EN ISO 14083 standard, for calculating the emissions of any transport service across road, rail, air and sea. Measured door-to-door, a published figure covers the whole journey instead of a single convenient leg. A free EU calculation tool is due to follow. Disclosure stays voluntary, though any operator that publishes a number now has to publish a comparable one.
Comparability is what turns a number into a target. Once a destination and its suppliers measure on the same basis, a baseline holds still long enough to set a goal against it and to track whether the line is moving.
The same logic is spreading through national programmes and industry initiatives. VisitScotland is rolling out a tourism and events carbon calculator in 2026, putting businesses across the country on one comparable baseline against Scotland’s net zero target for 2045. The hotel sector’s Hotel Carbon Measurement Initiative applies the same approach to emissions per room night, giving operators and corporate buyers a comparable number across properties.
Proving the Green Claim
Consistent measurement only counts once the claims a business makes in public are tied to those numbers. Where they are not, a business can appear to cut emissions without doing so, which takes the pressure off making real cuts.
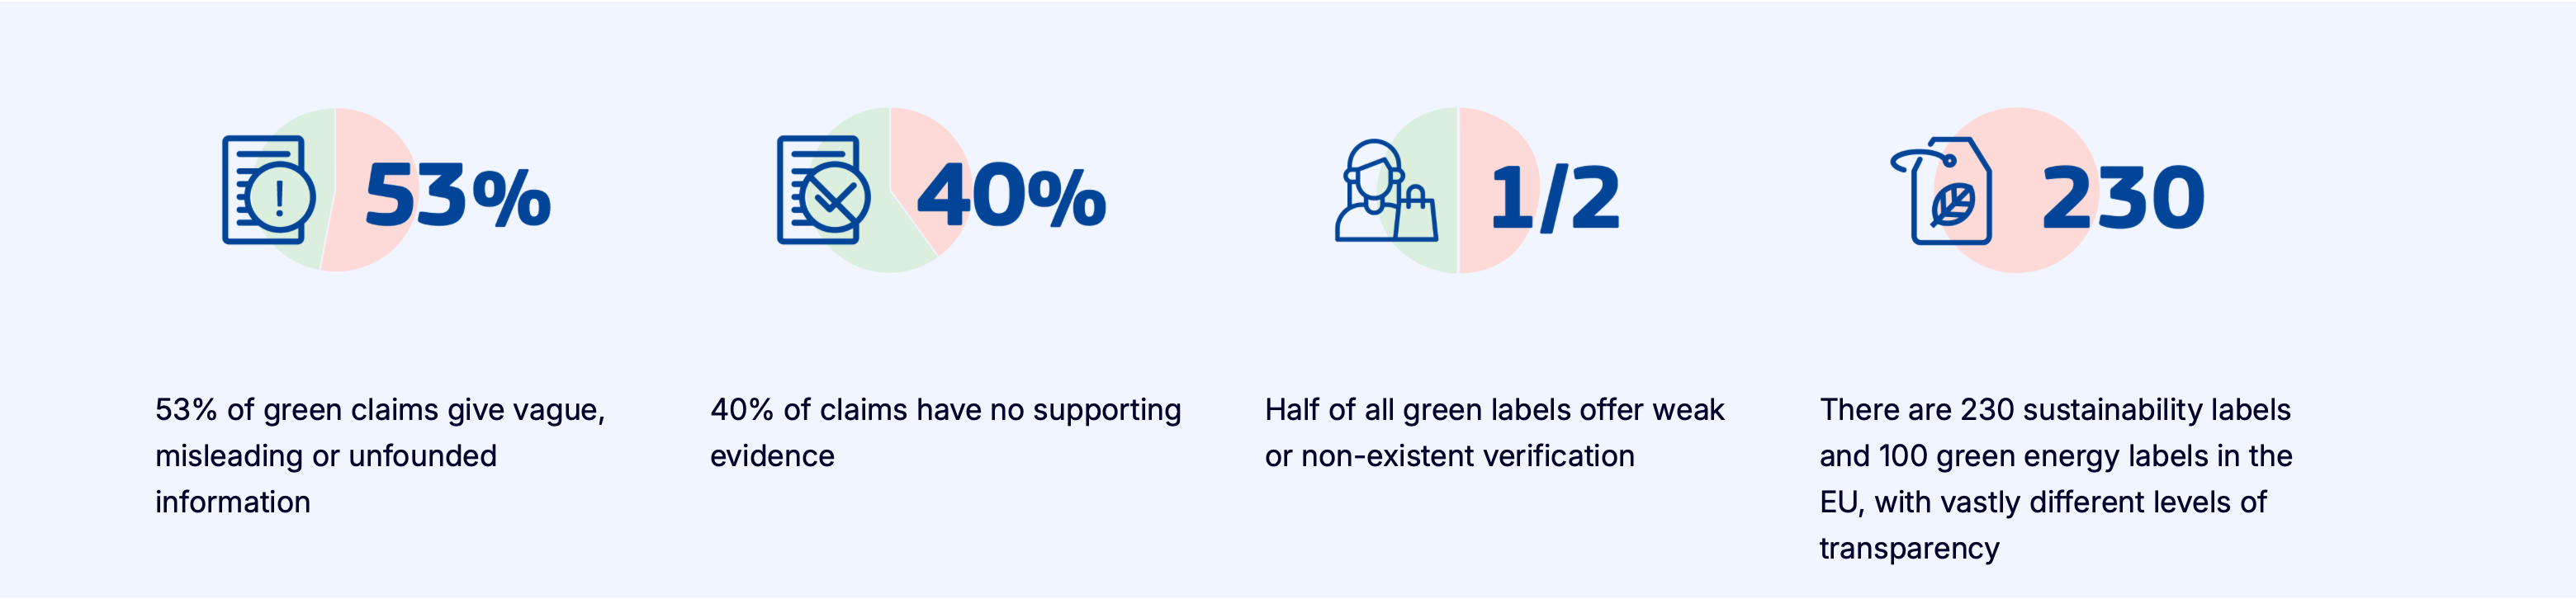
The record there is poor. A 2020 study of environmental claims found more than half were vague or unsubstantiated, with around 40% carrying no evidence behind them.
Aviation produced the clearest test of where that leads. The District Court of Amsterdam ruled in March 2024 that 15 to 19 KLM advertising statements were misleading and unlawful under the EU Unfair Commercial Practices Directive. The court took particular issue with the suggestion that buying an offset or contributing to sustainable aviation fuel meaningfully reduced the climate impact of a flight, finding these measures shifted the number far less than the advertising implied.
The Empowering Consumers for the Green Transition Directive turns that case law into a standing rule from 27 September 2026, banning generic green claims and offset-based “climate neutral” product labels across the EU, with penalties of up to 4% of turnover. A claim now needs evidence behind it, which is where measurement and the data tools that tie a lifecycle figure to a marketing line earn their place.
Offsetting changes role in the same move, going from a headline that lets a product call itself neutral to, at most, a step taken after measured reductions. A DMO that has counted its own emissions is far better placed to tell the difference. Closing the easy routes to a green label leaves one credible path: cutting emissions at the source.
Making the Low-Carbon Journey the Easy One
Comparable numbers and honest claims point to where the cuts have to come from, with transport carrying the most.
Regulation can set the direction, as France showed in 2023 by suspending domestic flights on the three Paris Orly routes where a train of under two and a half hours covers the same trip, a narrow rule, though a real one, since it removes the high-carbon option instead of nudging against it.
Green tech does most of the work by seamlessly making the lower-carbon route the easiest option. A great example is the partnership between ITA Airways and Trenitalia, which introduced a joint air-and-rail ticket and established an AI lab dedicated to driving intermodality and cutting emissions. Now, rather than risking misaligned connections, travellers can book their high-speed train and flight together as one streamlined itinerary.
Getting around once you arrive follows the same logic. Switzerland markets it directly through Swisstainable, its national sustainability programme, sitting on one of the densest rail networks in the world, roughly 3,000 kilometres of track with trains on hydropower and a single pass covering train, bus and boat, so a visitor can cross the country without a car.
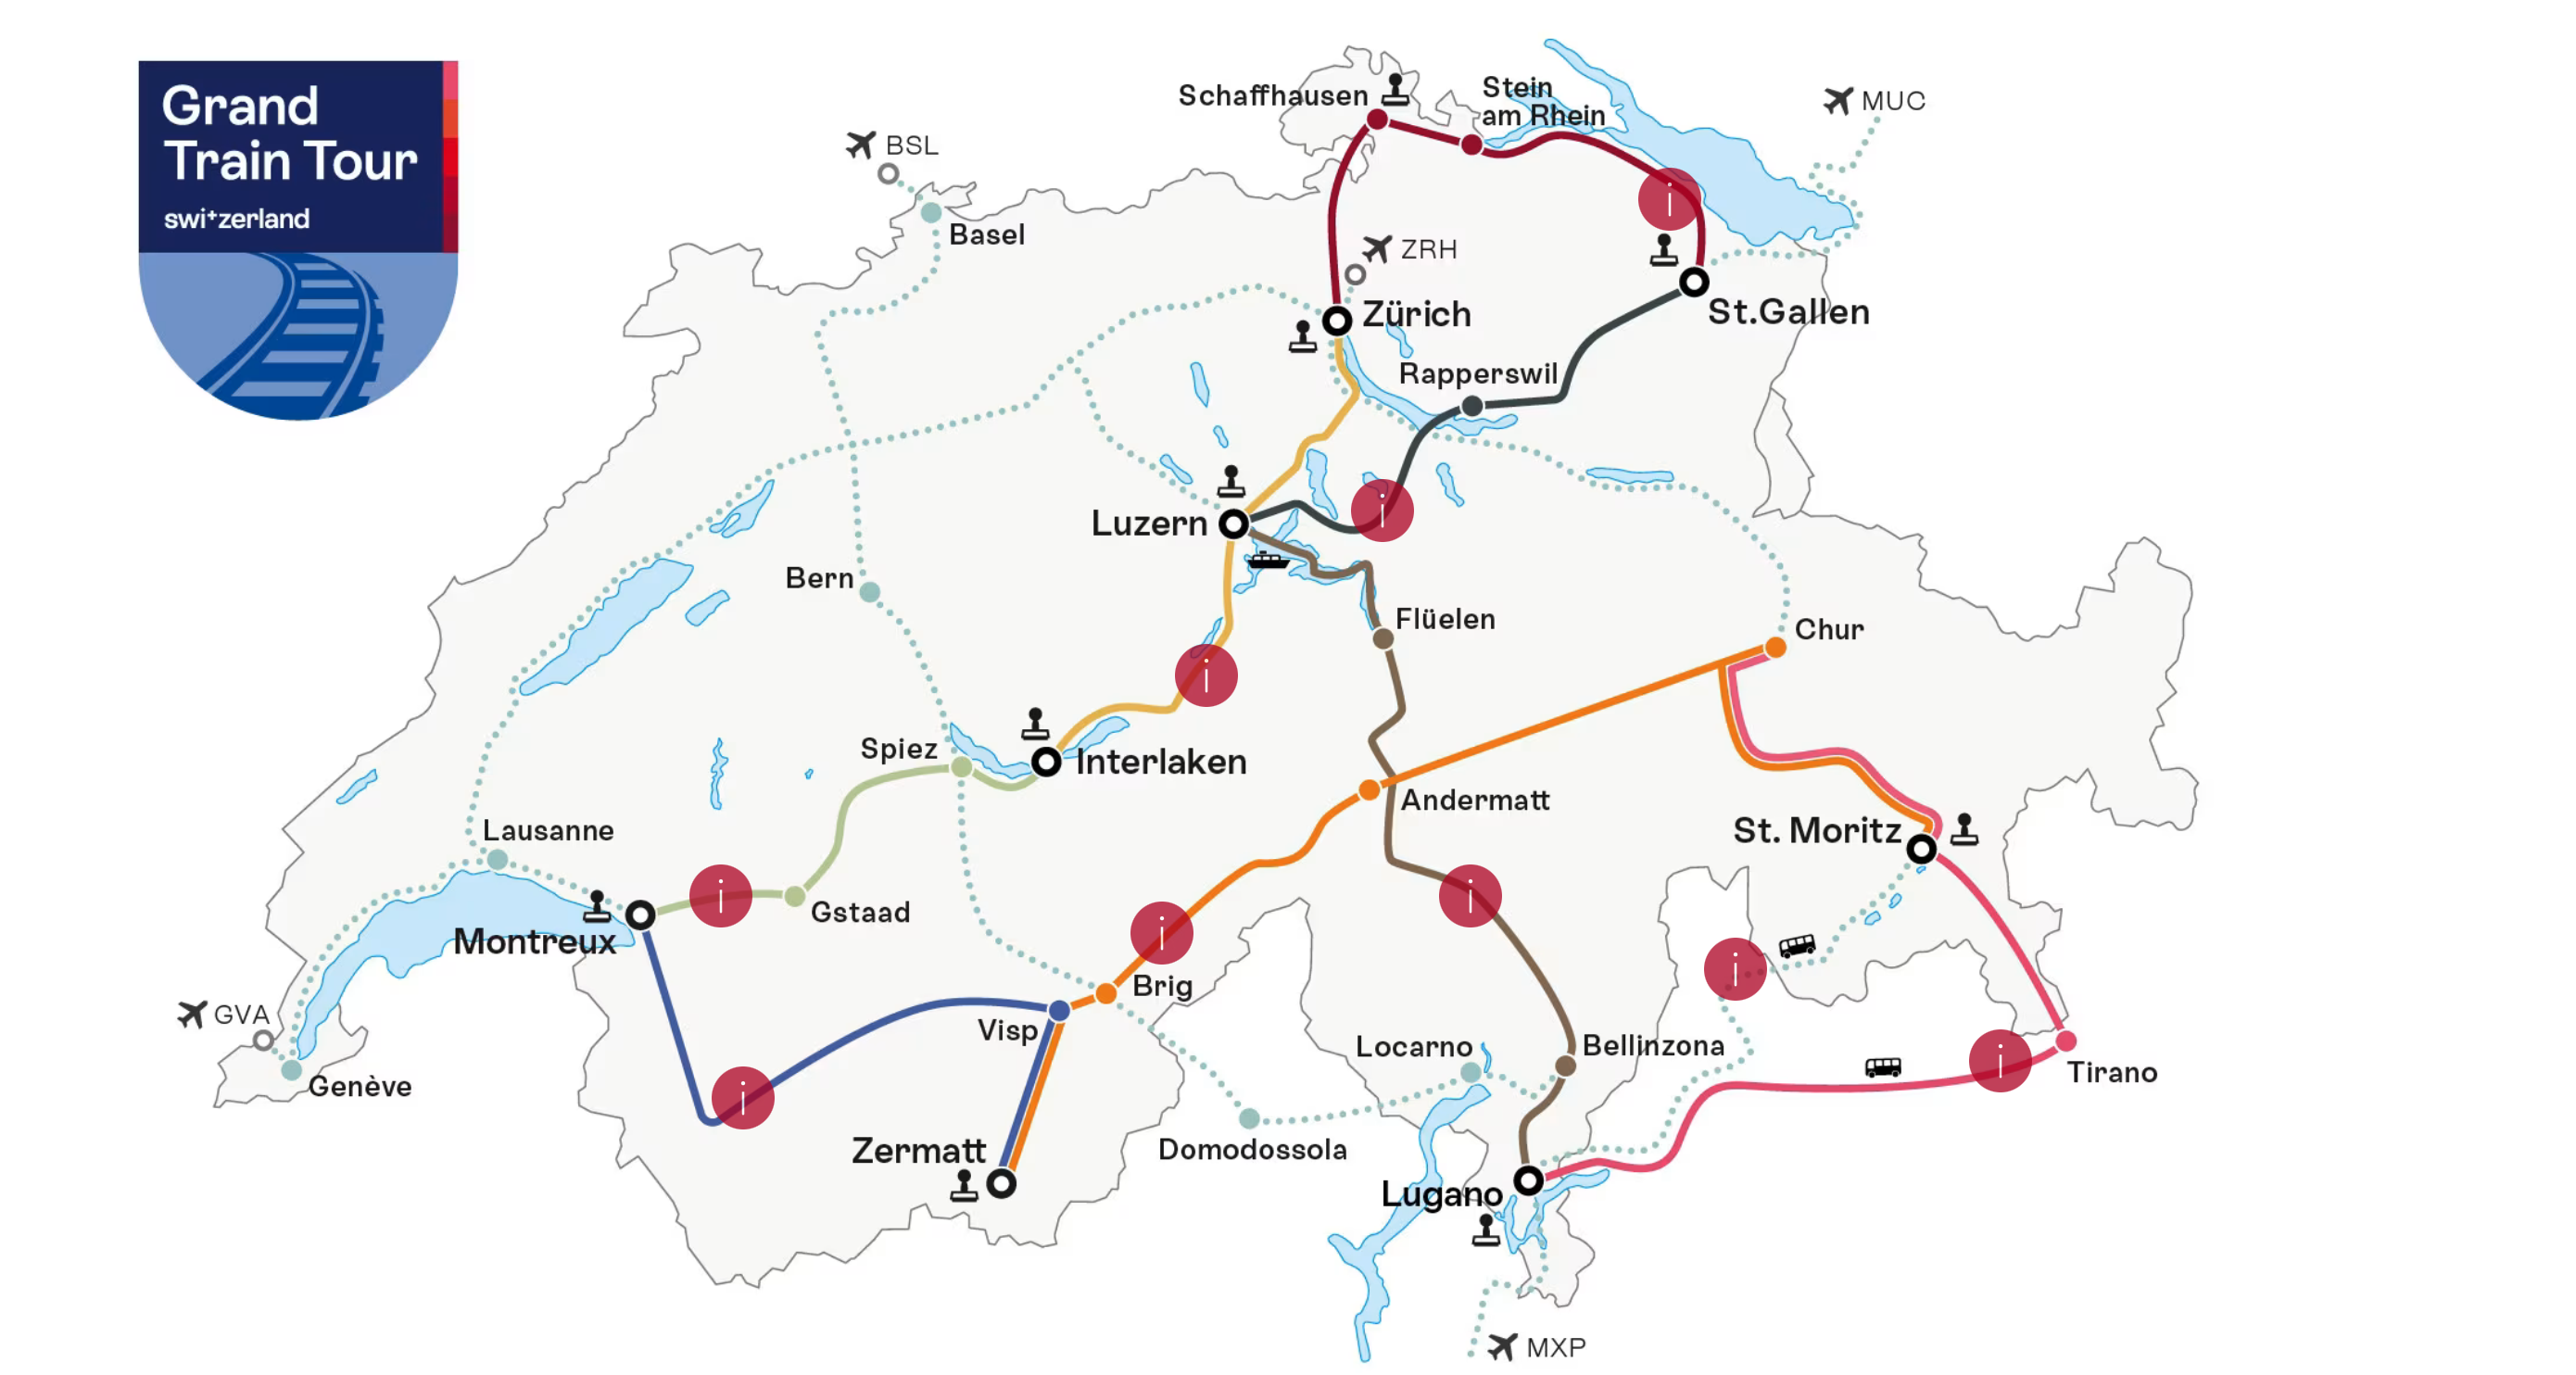
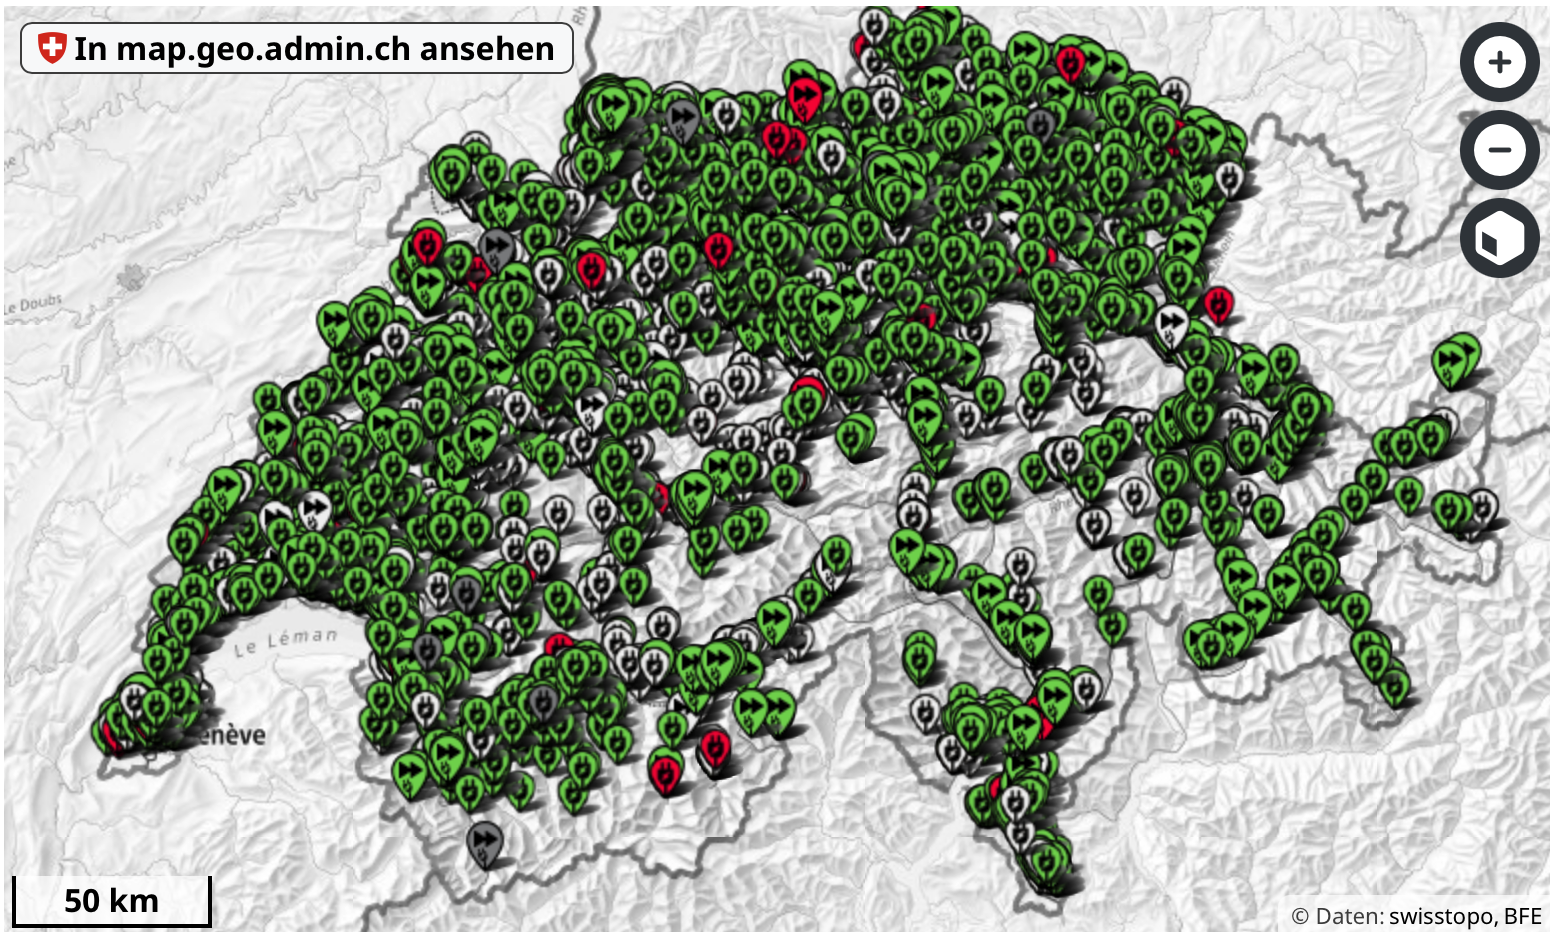
Road trips where rail is not an option face a different barrier, rarely the car and usually the doubt about where to charge. Maps like Electromaps answer that by pulling public charging points from many operators into one view across borders, with live availability and a single way to pay. Switzerland’s Grand Tour, billed as the first road trip designed for electric vehicles, shows the same idea built into a route.
Shifting transport modes works well when alternatives exist, but the highest emissions occur where they don’t, most notably with flying. On an island like Iceland, where flying is essential, air travel accounts for 50% to 82% of a visitor’s footprint. Furthermore, standard carbon accounting often ignores the non-CO2 warming effects of aviation, which make flights roughly two to three times more damaging to the climate than their CO2 alone.
While aviation remains a stubborn challenge, sea crossings offer a much more immediate path to decarbonisation. Viking Line’s newest ships between Turku and Stockholm operate on a liquefied natural and biogas blend, cutting emissions by up to 90% compared to fossil gas and saving nearly 50,000 tonnes in 2025. The limiting factors are supply and cost, with renewable marine fuel at least twice the price of the fossil version, so higher demand is needed to boost production. An archipelago cannot yet change the flights it relies on, but it can steadily decarbonise its sea routes.
Flying is the part that cannot be cleaned up the same way, so the lever moves to demand, focusing on who visits and from how far and for how long. Fáilte Ireland’s “Find Yourself on a Short Break” campaign, launched in March 2026, builds year-round domestic demand on a market worth €3.6 billion in 2024. Its stated aims are economic and seasonal, with the climate effect running alongside, since a short break close to home carries a fraction of the travel emissions of a long-haul one.
Putting Green Tech to Work
Transport is the part of the footprint a visitor chooses directly. A larger share sits out of sight, in the emissions embedded in everything a destination and its businesses buy, build and serve. Measurement is what shows how those layers compare and where the largest cuts are available.
The cases through the article map onto a clear structure. The GHG Protocol sorts emissions into three groups. The pattern of where they sit in tourism is consistent across studies. Direct emissions from a business's own operations, Scope 1, tend to be the smaller share. The energy a business purchases, Scope 2, is larger. The widest group is Scope 3, the emissions embedded across the value chain, taking in the visitor's journey along with the food, goods and services bought during the stay, which together account for the majority of the total. Estimates put the Scope 3 share around 57% of a tourism business's total.
Source: Claude.ai generated
Green tech maps onto these scopes in different ways. The supply chain layer is the biggest and the slowest moving, with integrated booking systems and procurement tools beginning to reshape what visitors and suppliers choose. Food is the part of that footprint a destination can most readily shift, through sourcing decisions and menu design. The operational and energy layers, smaller in absolute terms, are where renewable fuels and on-site generation make their mark on the figure.
A DMO does not directly control most of these emissions, so its role runs through influence. Publishing the figures on a shared basis, steering visitors towards the operators whose numbers have actually moved and asking partners to report their numbers as a condition of working together are the levers a DMO holds. The more complex part is institutional: reading the numbers consistently, holding the same method from one year to the next and turning each year's figure into the following year's target rather than a line in a report.
The destinations getting this right treat measurement and action as one piece of work. The count tells them where the footprint sits. The cuts and the claims both follow from it.
None of this becomes a single number a destination can post and forget. The credible version is quieter, counting on a shared basis and letting both the claims and the cuts follow from the count.
How can destinations build the measurement and transparency tools that turn climate progress from a claim to a verifiable number? CAMPUS 2026 is structured to tackle that question. Taking place from 30 September to 3 October in the Turku Archipelago, Finland, CAMPUS brings together destinations and industry to develop the green tech and shared methods that move the sector from sustainability claims to measured progress.

.png)
.png)